
Price gets all the attention. It’s the first number you see on any crypto tracker, the thing people screenshot when a trade goes well, and the metric that dominates headlines. But there’s a number that experienced traders almost always check alongside price and that’s crypto trading volume. Once you understand what volume is telling you, you’ll never look at a price chart the same way again.
This guide breaks down what trading volume actually means, why it matters, the patterns worth paying attention to, and how to use it to make better-informed decisions rather than reacting blindly to price movements.
What Is Crypto Trading Volume?
Trading volume is the total amount of a cryptocurrency that has been bought and sold over a specific time period usually measured over 24 hours. It’s displayed in either the number of coins traded or the USD equivalent of those trades, and it shows up as a bar chart at the bottom of most price charts.
Every completed trade contributes to volume. When a buyer and a seller agree on a price and execute a trade, that transaction is recorded. Add up all the transactions over 24 hours and you have the daily volume.
Volume is fundamentally a measure of participation. High volume means a lot of people are actively trading that asset. Low volume means relatively few traders are engaged. That distinction carries more information than it might seem at first glance.
Why Volume Matters More Than Most People Realise
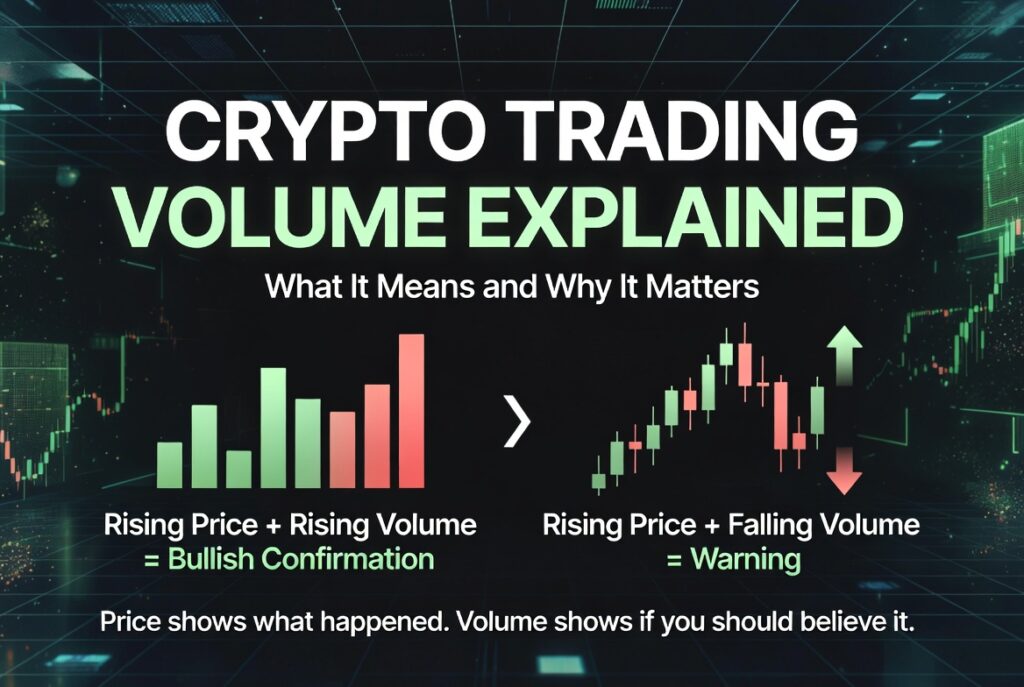
Here’s the core insight: price tells you what happened, but volume tells you whether to believe it.
A price move on high volume has conviction behind it. A lot of traders participated in that move, which means there was genuine agreement that the price should be where it ended up. A price move on low volume is thin and suspicious – it might reflect a small number of trades, low liquidity, or even manipulation. It’s much more likely to reverse.
Think of it like a vote. If a decision passes with 90% turnout, it carries real weight. If it passes with 5% turnout, you’d be right to question how representative it actually is.
The Four Volume Patterns Every Trader Should Know
Volume analysis doesn’t require complex tools. Most of the actionable information comes from watching how volume relates to price direction. There are four basic combinations, and each tells a different story.
Rising Price with Rising Volume: The Bullish Confirmation
When a coin’s price is climbing and volume is increasing alongside it, that’s a healthy, confirmed uptrend. The rising volume shows that more participants are buying into the move, which suggests genuine demand rather than a thin, easily reversed rally.
This is the pattern you want to see when a coin breaks above a resistance level. A breakout on strong volume is far more likely to hold and continue than a breakout on light volume. When both price and volume are trending upward together, the move has credibility.
Rising Price with Falling Volume: A Warning Sign
This combination is one of the most underappreciated warning signs in technical analysis. When a coin’s price keeps going up but volume is declining, it means fewer and fewer participants are driving that rally. The buyers are running out of conviction, even as the price still looks strong.
This pattern often precedes a reversal. The price is moving up on momentum alone, not on fresh demand. When volume dries up completely and the remaining sellers start to push back, there aren’t enough buyers to absorb the selling pressure. What looked like a continuation becomes a top.
Watch for this pattern especially on coins that have already made a significant move. A rally that’s been going for weeks but is now rising on shrinking volume is worth treating with caution.
Falling Price with High Volume: Real Selling Pressure
When a coin is dropping and volume is high, that’s a sign of genuine distribution meaning a significant number of traders are selling. This isn’t casual profit-taking or noise; it’s meaningful capitulation or active exit.
High-volume drops are particularly significant when they happen at key support levels. If a coin breaks below a major support zone with heavy volume, that breakdown is far more likely to continue lower than if the same level was broken on thin volume. The market is telling you something.
That said, extremely high volume during a sharp drop can also signal a capitulation event – a moment where the last sellers exhaust themselves. These climactic volume spikes sometimes mark bottoms, particularly when the price recovers quickly after the high-volume flush.
Falling Price with Low Volume: Possible Exhaustion
This is the flip side of the rising price on low volume pattern. When a coin is drifting lower but volume is thin, it suggests the selling isn’t particularly urgent or widespread. There’s no panic, no large holders dumping – just a quiet pullback without strong participation.
This pattern often appears during healthy corrections within a broader uptrend. The price is coming down, but the lack of volume suggests sellers aren’t particularly motivated. Once the pullback finds a support level and buyers re-engage, a bounce often follows.
It’s much less alarming than a high-volume drop. The absence of selling conviction is itself a form of information.
Volume and Breakouts: The Most Practical Application
If there’s one place where volume analysis pays dividends most reliably, it’s evaluating breakouts. A breakout occurs when a coin’s price moves above a resistance level it has failed to break through multiple times before.
The question every trader should ask when they see a breakout: did volume confirm it?
- High volume on a breakout – the move has broad participation, real buyers stepped in, and the breakout is more likely to sustain
- Low volume on a breakout – the move may be a false breakout, driven by a small number of trades in thin market conditions; fakeouts like this are common and frequently trap buyers
The professional approach is to wait for the volume confirmation before entering a breakout trade rather than chasing the price move the moment resistance is breached. Yes, you’ll miss the very first tick of the move sometimes. But you’ll also avoid a significant number of false breakouts that would have cost you money.
Volume Across Different Timeframes
Just like price charts, volume analysis changes character depending on which timeframe you’re looking at.
- On short timeframes (minutes to hours) – volume spikes can indicate news events, large orders hitting the market, or short-term manipulation; useful for day traders but can be misleading in isolation
- On daily charts – the most commonly used timeframe for volume analysis; daily volume gives a reliable picture of participation and helps confirm or question trend direction
- On weekly charts – high volume weeks mark genuinely significant market events; capitulation bottoms and major breakouts often show up clearly on weekly volume
Cross-referencing volume across multiple timeframes gives you a more complete picture. A breakout that shows up on both the daily and weekly volume charts is significantly more meaningful than one that only shows up intraday.
The Limits of Volume Analysis
Volume is powerful, but it has real limitations in crypto that are worth understanding.
Wash Trading Is a Real Problem
Wash trading – where exchanges or projects artificially inflate volume by trading with themselves has been documented across many centralised exchanges, particularly smaller ones. A coin might show enormous volume figures that are largely fabricated, making it look more liquid and active than it really is.
To get cleaner volume data, prioritise coins and exchanges with a strong reputation for reporting standards. DEX volume on-chain is generally harder to fake and can be a more reliable signal for DeFi assets.
Context Always Matters
Volume numbers only make sense relative to what’s normal for that specific coin. A daily volume of $5 million means very different things for a micro-cap token versus an established mid-cap project. Always compare current volume to the coin’s historical average rather than treating the raw number in isolation.
Summary
Crypto trading volume explained simply: it’s the heartbeat of the market. Price tells you where a coin is; volume tells you how many people believe it belongs there. A price move without volume behind it is gossip. A price move confirmed by volume is a statement.
Start adding volume to your chart analysis not as the only signal, but as the confirmation layer that separates high-conviction moves from noise. The more you practise reading volume alongside price, the better your instincts for when to act and when to wait will become.